The Physical Science Basis
The Working Group 1 component of the IPCC 5th Assessment Report (AR5; IPCC 2013a) was released in late 2013. It is a vast assessment of the published, peer-reviewed, literature on observed and projected climate change, written by a team of over 200 volunteer scientists. The main findings of the 1500-page full report were boiled down to a 29-page “Summary for Policy Makers”(IPCC 2013b) and then super-summarised in a series of nineteen “headlines”, available on the IPCC web site at www.climatechange2013.org/images/uploads/WG1AR5_Headlines.pdf
These headlines are highlighted and fleshed out with discussion from the full report and personal reflections and opinions.
The overall message from the AR5 can be summarised as: we are sure that human activity is the key driver of present-day climate change. To avoid major and long-lived changes to the climate system, we have an urgent need to make deep cuts to greenhouse gas emissions, and to reduce them to zero by the end of the century, preferably sooner. Failure to do so will lead to a climate not seen on Earth for tens of millions of years, associated with several metres of sea level rise, large increases in many climate extremes, and major changes to water availability and food security globally.
As detailed in the previous IPCC report (the AR4; IPCC 2007), warming of the climate system is unequivocal. That is, we are certain that the climate system is changing, based on a wide variety of observational data sets covering the atmosphere, the oceans, and the cryosphere (ice and snow), as shown in Figure 1.
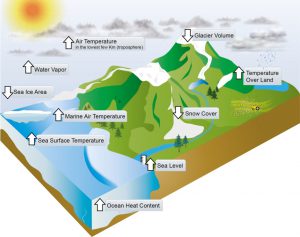
Figure 1: A schematic of observed changes in components of the climate system associated with a warming world. From IPCC AR5 Chapter 2 (Hartmann et al. 2013), FAQ 2.1 Figure 1 (and associated Figure 2).
Since the 1950s, many observed changes in climate are unprecedented over decades to thousands of years. Not only is the magnitude of recent change unprecedented, but also the rate of change in terms of the increase in greenhouse gas concentrations in the atmosphere. Greenhouse gas concentrations are a critical control on Earth’s surface temperature, as has been understood for well over a hundred years. The atmospheric concentrations of the main greenhouse gases (carbon dioxide (CO2), methane, and nitrous oxide) have increased extremely rapidly to levels not seen for at least the last 800,000 years (Schilt et al 2010). In the Northern Hemisphere, the 30-year period 1983–2012 was likely (at least 67% chance) the warmest 30-year period of the last 1400 years. Around three million years ago, carbon dioxide concentrations were between 350 and 450 parts per million (ppm), approximately as high as they are now (400 ppm). At that time, global sea levels were between 10 and 20 metres higher than present and temperatures were 2- 3°C higher than present, based on geological evidence (e.g. Pollard and DeConto 2009).
Ocean warming dominates the increase in energy stored in the climate system, accounting for more than 90% of the energy accumulated between 1971 and 2010. Warming of the atmosphere and melting of glaciers and ice sheets accounts for only a few percent of the increased heat storage in the climate system. We know that the build-up of heat is almost all due to increased greenhouse gas concentrations in the atmosphere, especially the increases in carbon dioxide concentrations. We also know, from chemical analysis of the carbon dioxide in the atmosphere, that the observed increases are all due to human activity, mostly the burning of fossil fuels. Hence, the IPCC AR5 concludes: Human influence on the climate system is clear. Figure 2 illustrates several of the broad- ranging changes observed in different components of Earth’s climate.
As stated in the IPCC headlines: “Human influence has been detected in warming of the atmosphere and the ocean, in changes in the global water cycle, in reductions in snow and ice, in global mean sea level rise, and in changes in some climate extremes. This evidence for human influence has grown since AR4. It is extremely likely that human influence has been the dominant cause of the observed warming since the mid-20th century.”
While the day-to-day weather we experience changes very quickly, many elements of the climate system vary on much longer time scales. The global ocean circulation and the major ice sheets have response times on the order of 1000 years. This is about the time it takes for surface heating to percolate fully to the bottom of the oceans and the time it takes water to do a circuit of the deep ocean. It is also roughly the time it takes for the Greenland or West Antarctic ice sheet to break up and melt into the sea. The deep ocean and the major ice sheets have hardly begun to respond to the greenhouse gas increases that have already occurred. So the changes we have already made to the climate are locked in for at least several hundred years, in terms of ice melt and sea level rise (Church et al. 2013).
The rate of sea level rise since the mid-19th century has been larger than the average rate during the previous 2000 years. The rate of sea level rise approximately doubled between the 1950s and the early 2000s, and the rate of rise is set to double and double again as we proceed through this century, if greenhouse gas emissions remain high. Sea level rise will definitely continue for several hundred years, the only question is how fast, and how much in total. If atmospheric concentrations of carbon dioxide are maintained at 400ppm and above over the coming century, paleoclimate evidence suggests that much of the Greenland and West Antarctic ice sheets are likely to melt over the next thousand years or so, adding at least 10m to sea levels, on top of the rises due to thermal expansion of ocean water and glacier melt. If we reduce emissions to zero this century, total sea level rise over the longer term may be capped at not much more than one metre.
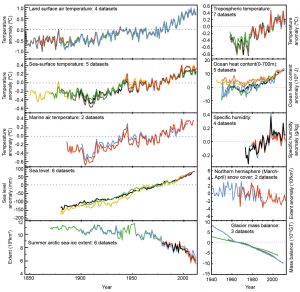
Figure 2: Observed changes in several key measures of the climate system, since the late 19th century (left) or the mid-20th century (right). From IPCC AR5 Chapter 2, FAQ 2.1 Figure 2.
Around 30% of emitted CO2 is absorbed into the oceans, making sea water more acidic. Hydrogen ion concentrations (a measure of acidity and the basis of the ‘pH’ scale) in sea water have already increased 26% over the last two centuries. The trend towards more acidic ocean waters will continue as long as CO2 concentrations rise. As the acidity increases, carbonate concentrations decrease, making it harder for marine organisms that rely on carbonate shells (such as shellfish and some micro-organisms) to grow and survive. By the end of the century, colder waters such as the Arctic Ocean would become corrosive to carbonates, unless CO2 emissions are substantially reduced.
Based on greenhouse gas emissions scenarios, the so-called “guard-rail” limit of 2°C of global warming is very likely to be exceeded unless we begin substantial cuts to greenhouse gas emissions this decade. Helped in part by a strong El Niño, global surface temperatures have reached all-time highs during 2015 and early 2016. For the calendar year 2015, the global mean surface temperature reached 1°C above pre-industrial levels. To stay under the 2°C limit, we cannot afford to emit more than about one trillion tons of carbon in total. We have already burnt more than half that total, and continuing with “business as usual” will see the other half gone in less than 30 years (Fig. 3). Using up all known fossil fuel reserves may eventually (over the next few centuries) result in 7 or 8°C or more of warming, putting us into a climate not seen for over 50 million years, when crocodiles and turtles roved the Arctic Ocean. We can be sure that such a climate would not support today’s global agricultural production, and the low-lying areas where the bulk of the global population live would all be under water.
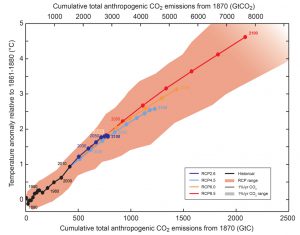
Figure 3: The relationship between global mean surface temperature increase and cumulative total global CO2 emissions, based on results from a range of future greenhouse gas emissions scenarios (RCPs, Representative Concentration Pathways) applied to a range of climate-carbon cycle models. Results over the historical period (1860 to 2010) are indicated in black and the coloured plume illustrates the multi-model spread over the four RCP scenarios. From IPCC AR5 SPM Figure10.
The spatial pattern of warming is very likely to follow the pattern already observed over recent decades, with the fastest warming in the Arctic and the slowest over the southern oceans. Figure 4 illustrates this pattern, showing the average regional change in temperature for every degree of global warming. In the Arctic, the rate of temperature rise is roughly double the global average. Over the southern oceans, where the ocean circulation is drawing heat rapidly down from the surface, warming is only a half of the global rate. Paleoclimate evidence shows that eventually both poles warm around twice the global average amount. In the Arctic, this response can happen relatively quickly while in the Antarctic it requires the melting of most of the continental ice before accelerated warming becomes apparent. See Chapter 5 of the IPCC AR5 for more details.
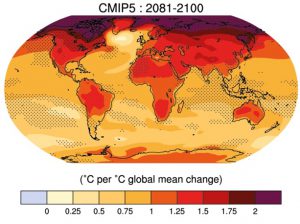
Figure 4: The pattern of temperature rise associated with 1°C of global warming, based on an average of several climate model projections. Colours indicate the 100-year change in temperature (2081-2100 minus 1986-2005), per °C of global average change. Dots show areas where the magnitude of change is significantly different to that found in the previous IPCC report. From IPCC AR5 Chapter 12, Figure 12.41.
In the Arctic, sea ice cover is decreasing rapidly and will continue to shrink and thin, as regional effects amplify the global warming signal. In the Antarctic, sea ice extent has gradually increased over the past 40 years, apparently as a result of natural variations in surface winds. However, that trend is likely to reverse over coming decades, with losses in Antarctic sea ice by the end of the century.
As temperatures rise, patterns of rainfall also change, regionally and globally. A warmer climate goes with more evaporation and more moisture in the atmosphere. So rainfall tends to be heavier, when it happens. Conversely, more evaporation can lead to drier soils and a greater risk of drought in some regions. A good rule of thumb is that the contrast in precipitation between wet and dry regions, and between wet and dry seasons, will increase – in other words, the wet get wetter and the dry get drier. There will be regional exceptions but that is a good first approximation. Such a “rule” is likely to apply to New Zealand, where the already-wet western regions of the country are likely to become wetter overall, while the dry east (and far north) becomes drier (Christensen et al. 2013). Figure 5 shows the pattern of rainfall change, in schematic fashion.
As the climate warms, less winter precipitation will fall as snow and more as rain. This changes the seasonality of snowpack accumulation and melt, and of the flows in major rivers. Globally, snow cover in spring and summer is very likely (at least 90% likely) to continue decreasing, and glacier ice volume is also very likely to keep decreasing. Such changes have major implications for water resources worldwide.
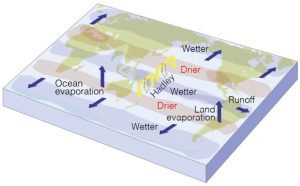
Figure 5: A schematic of future changes in rainfall and the water cycle. Blue arrows show movement of water through the climate system. Shading shows regions (latitude bands) becoming drier or wetter. The yellow arrows show the broadening of the tropical overturning “Hadley” cells, broadening the whole tropical belt and moving subtropical desert regions poleward. From IPCC AR5 Chapter 12, FAQ 12.2 Figure 1.
In summary, we have some serious choices to make. As the IPCC Headlines note, “Limiting climate change will require substantial and sustained reductions of greenhouse gas emissions” and “Most aspects of climate change will persist for many centuries even if emissions of CO2 are stopped.” If we carry on with “business as usual” we will push the climate system into a state not seen for millions of years, and likely incompatible with current human population and food production levels. If we take serious steps within the next decade to cap greenhouse gas emissions and to reduce them to zero before 2100, we stand a good chance of limiting climate change to manageable levels.
References
- Christensen, J.H., K. Krishna Kumar, E. Aldrian, S.-I. An, I.F.A. Cavalcanti, M. de Castro, W. Dong, P. Goswami, A. Hall, J.K. Kanyanga, A. Kitoh, J. Kossin, N.-C. Lau, J. Renwick, D.B. Stephenson, S.- P. Xie and T. Zhou, 2013: Climate Phenomena and their Relevance for Future Regional Climate Change. In: Climate Change 2013: The Physical Science Basis. Contribution of Working Group I to the Fifth Assessment Report of the Intergovernmental Panel on Climate Change [Stocker, T.F., D. Qin, G.-K. Plattner, M. Tignor, S.K. Allen, J. Boschung, A. Nauels, Y. Xia, V. Bex and P.M. Midgley (eds.)]. Cambridge University Press, Cambridge, UK and New York, NY, USA.
- Church, J.A., P.U. Clark, A. Cazenave, J.M. Gregory, S. Jevrejeva, A. Levermann, M.A. Merrifield, G.A. Milne, R.S. Nerem, P.D. Nunn, A.J. Payne, W.T. Pfeffer, D. Stammer and A.S. Unnikrishnan, 2013: Sea Level Change. In: Climate Change 2013: The Physical Science Basis. Contribution of Working Group I to the Fifth Assessment Report of the Intergovernmental Panel on Climate Change [Stocker, T.F., D. Qin, G.-K. Plattner, M. Tignor, S.K. Allen, J. Boschung, A. Nauels, Y. Xia, V. Bex and P.M. Midgley (eds.)]. Cambridge University Press, Cambridge, UK and New York, NY, USA.
- Hartmann, D.L., A.M.G. Klein Tank, M. Rusticucci, L.V. Alexander, S. Brönnimann, Y. Charabi, F.J. Dentener, E.J. Dlugokencky, D.R. Easterling, A. Kaplan, B.J. Soden, P.W. Thorne, M. Wild and P.M. Zhai, 2013: Observations: Atmosphere and Surface. In: Climate Change 2013: The Physical Science Basis. Contribution of Working Group I to the Fifth Assessment Report of the Intergovernmental Panel on Climate Change [Stocker, T.F., D. Qin, G.-K. Plattner, M. Tignor, S.K. Allen, J. Boschung, A. Nauels, Y. Xia, V. Bex and P.M. Midgley (eds.)]. Cambridge University Press, Cambridge, UK and New York, NY, USA.
- IPCC, 2007: Summary for Policymakers. Climate Change 2007: The Physical Science Basis. Contribution of Working Group I to the Fourth Assessment Report of the Intergovernmental Panel on Climate Change.
- IPCC, 2013a: Climate Change 2013: The Physical Science Basis. Contribution of Working Group I to the Fifth Assessment Report of the Intergovernmental Panel on Climate Change [Stocker, T.F., D. Qin, G.-K. Plattner, M. Tignor, S.K. Allen, J. Boschung, A. Nauels, Y. Xia, V. Bex and P.M. Midgley (eds.)]. Cambridge University Press, Cambridge, UK and New York, NY, USA, 1535 pp.
- IPCC, 2013b: Summary for Policymakers. In Climate Change 2013: The Physical Science Basis. Contribution of Working Group I to the Fifth Assessment Report of the Intergovernmental Panel on Climate Change, T. F. Stocker, and Coauthors, Eds., Cambridge University Press.
- Pollard, D., and R. M. DeConto, 2009: Modelling West Antarctic ice sheet growth and collapse through the past five million years. Nature, 458, 329–332.
- Schilt, A., M. Baumgartner, T. Blunier, J. Schwander, R. Spahni, H. Fischer, and T. F. Stocker, 2010: Glacial–interglacial and millennial-scale variations in the atmospheric nitrous oxide concentration during the last 800,000 years. Quat. Sci. Rev., 29, 182–192.
Peer reviewed by
Dr David Wratt, Chief Scientist - Climate NZ National Institute of Water and Atmospheric Research (NIWA)
While the reviewer has provided comment on drafts of this article, he does not necessarily endorse it in its final form. The author is solely responsible for any errors and judgements that may exist in the published article.
v4.2 16th May 2016