Climate Change and Sea Level Rise
In simplified summary, the problem is this: increasing carbon dioxide in the atmosphere causes an increase in global temperature; this warming causes polar ice to melt; this extra, warmer water causes sea-level rise; and this causes flooding problems for our cities, which are built on low-lying coastal margins.
The world's climate scientists agree that 'greenhouse' gases (including carbon dioxide CO2, methane, nitrous oxide, and water vapour), trap heat in the atmosphere and so contribute to global warming. Carbon dioxide is the longest-lived greenhouse gas and therefore the biggest driver of climate change. The amount of carbon dioxide in the atmosphere has risen by 40% since pre-industrial times, and now stands at levels unprecedented in at least the last 800,000 years [8]. The Intergovernmental Panel on Climate Change (IPCC), based on input from the world’s climate scientists, agree that this rise is certain (beyond reasonable doubt) to have been caused by human activity, mainly through the release of greenhouse gases into the atmosphere from the burning of fossil fuels since the start of the Industrial Revolution (about 1800) [8].
Figure 1 shows historical levels of CO2 over the last 400,000 years, reconstructed from ice- core samples. Note that over this very long period of time, CO2 concentration has never gone above 300 parts per million (ppm). Note too the very sharp increase to more than 400 ppm in recent times, consistent with human activity in the Industrial Revolution.
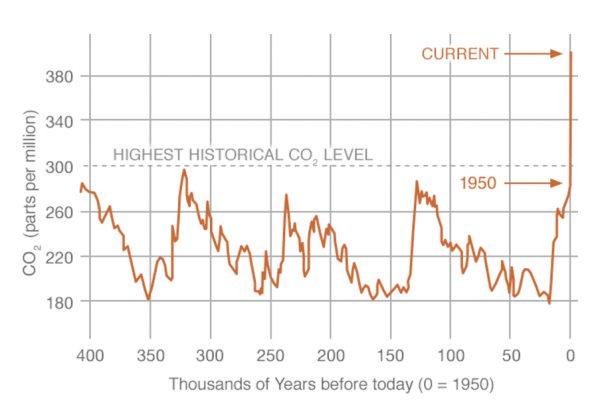
Figure 1: Historical levels of CO2 (Source: NASA [16])
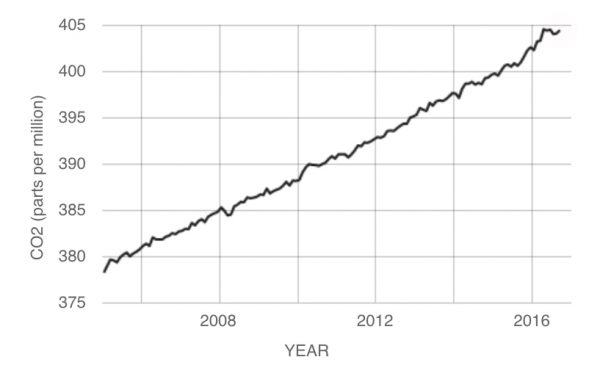
Figure 2: Global CO2 levels since 2005, with seasonal variation removed
(Source: NASA/NOAA [16])
Contrary views
Using a scientific approach or otherwise, some authors have attempted to show that global warming is not occurring, or if it is, then it is not produced by human activity (anthropogenic). These arguments have been discussed and refuted in several places, most notably the Skeptical Science website [17]. See also Paper 10 in the ESR series for a discussion of the psychological aspects of our response to climate change [18].
Weather forecasts
Weather forecasts are produced using complex computer models which employ past measurement data. In a similar way, climate scientists can take our knowledge of past events to predict how the climate will behave in the future. Different outcomes are possible within a certain range, depending on factors such as the level of CO2 emissions into the future.
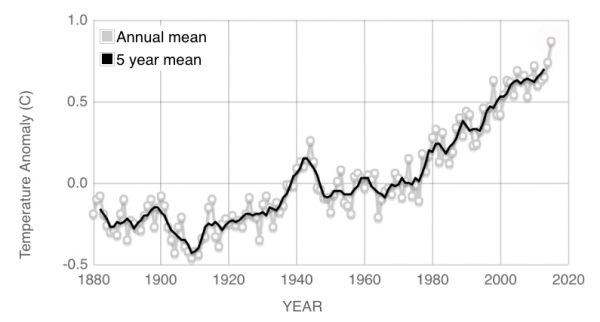
Figure 3: Global temperature rise since 1880 (Source: NASA/GISS [16])
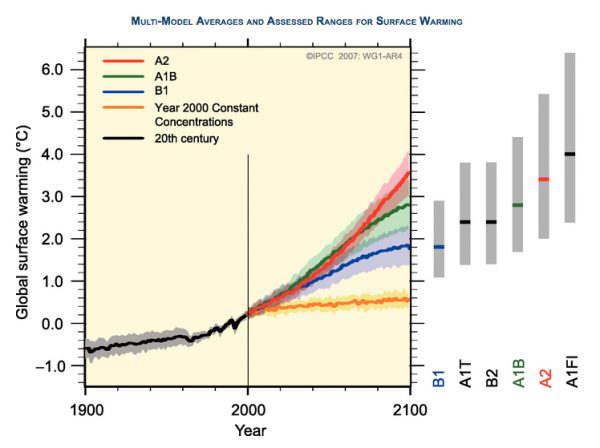
Figure 4: Observed and projected temperature changes, 1900 - 2100 (Source: IPCC [19])
- Ice on the Earth's land surface (e.g., glaciers, ice sheets) melts, contributing more water mass to the oceans.
- Floating polar ice shelves diminish, reducing the buttressing of large ice sheets in Greenland and Antarctica, by the action of warmer waters underneath.
- Increases in ocean temperature cause an expansion in the volume of sea water, and therefore an increase in sea level.
- The melting of floating ice in polar oceans changes the albedo (whiteness), reducing the energy from the sun which can be reflected back into space.
- Positive feedback mechanisms mean that the rate of polar ice-sheet melting at the higher end is uncertain.
Measurements of global sea level show that it is rising. Figure 5 shows that sea-level has risen about 200 mm since 1870, corresponding to a rise of a little over 1.5 mm per year.
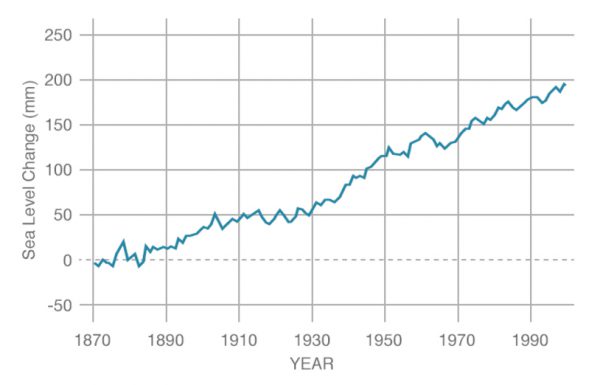
Figure 5: Global mean sea-level since 1870, based on coastal tide gauge records
(Source: NASA/CSIRO16)
More recent measurements (since 1993) of sea-level confirm the upward trend (Figure 6); however, the rate of rise has increased in this more recent period to 3.4 mm/year.
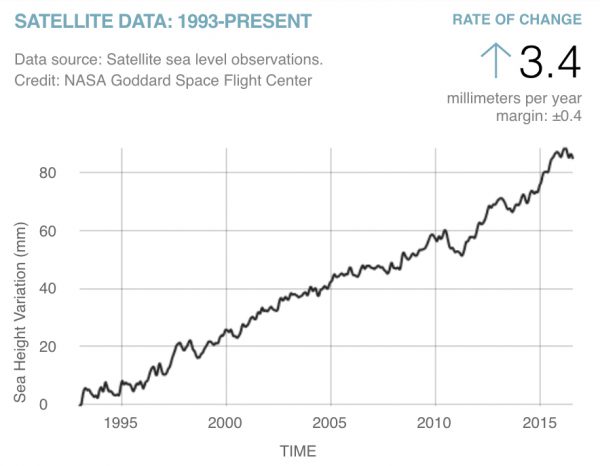
Figure 6: Increasing rate of sea-level rise in recent times (Source: NASA/GISS [16])
The 5th IPCC Assessment Report (AR5) provides projections for sea-level rise up to 2100 (Figure 7) for various 'pathways' of surface heating per square metre. These pathways describe different climate futures, all of which are considered possible depending on the quantity of greenhouse gases emitted in the years to come. The highest pathway, RCP 8.5 (brown colour), is essentially 'business as usual' with continued global population growth, while the lowest, RCP 2.6 (blue), represents severe emissions reductions to zero by 2075 and global population decline [8].
These projections indicate that sea-level rises of 0.5 to 1 metre are likely to occur by 2100. Present Ministry for the Environment guidance, based on this Assessment Report, suggests that it is prudent for New Zealand coastal communities to plan on the basis of 0.8 metre rise by the 2090s, extending out to 1 metre of sea level rise or more by 2115, with contingency plans for adapting to multi-metre sea level rise at some unknown future time [13].
The IPCC projections are however considered conservative by some authors, since they do not take full account of melting of Antarctic ice. Recent research by Hansen and others indicates that the sea level could rise considerably faster due to runaway ice-sheet collapse in parts of Greenland and West Antarctica, rising by several metres in the next few centuries. Depending on the degree to which emissions are limited, this research suggests that by 2100 sea-level could be as much as 1 metre above that predicted by AR5, i.e. up to 2 metres of sea-level rise [10], [11], [12], [20], [21], [22]. Hansen expresses the view that 2 degrees of global warming as permitted by the Paris Accord (COP 21) is dangerously high. However, it is probably fair to say that Hansen's figures represent an extreme upper limit and can not yet be regarded as scientific consensus.
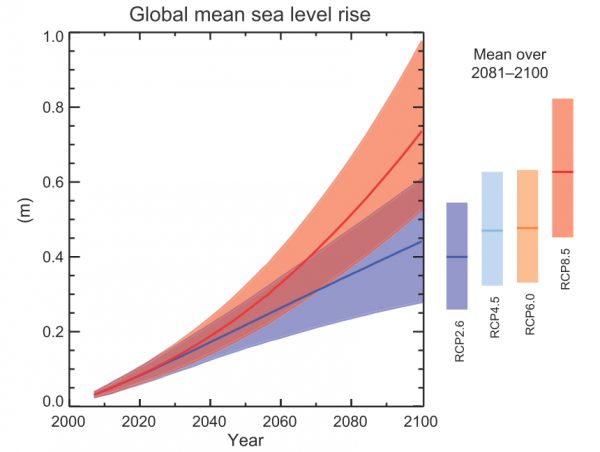
Figure 7: Projections for global mean sea level rise [8].
In contrast to these large and sometimes rapid changes in the distant past, sea level has been comparatively stable over the last several thousand years when our coastal society developed. Salt marsh sediment cores and long-lived corals indicate rates of sea-level change of only a few tenths of a millimetre per year over that recent geological period. This almost static state has enabled us to develop our cities on low-lying shores.
Today, coastal population densities are more than twice the global average. About 150 million people live on land less than one metre above mean high water level, with about a trillion dollars of gross domestic product generated in this same area [4]. Many of the world's mega- cities, with populations greater than 10 million, lie in the coastal zone. About 300 million people inhabit deltaic (river delta) regions around the globe, often with population densities of many hundreds of people per square kilometre. These populations are already vulnerable to rising relative sea levels because the land is sinking as a result of compacting of deltaic sediments and the loss of sediment supply.
Some populations, especially in the Pacific, live on low-lying islands and coral atolls only a few metres above sea level. Despite the problems already occurring in these regions, with over 200 million people already vulnerable to flooding, the coastal regions are continuing to undergo rapid economic development and increased urbanization, with migrations to the coast in both developed and developing nations [4].
The effects of sea-level rise in New Zealand are already being studied. Around 7–8% of our population (based on the 2006 census) live in coastal areas below 5 metres above mean spring tide [14], [15]. As sea levels rise, the frequency of storm-tide inundation becomes greater. What was a 'one in a hundred year event' occurs perhaps every few years [23]. Figure 8 shows the considerable impact of storm-tide inundation on properties in the Mission Bay and Kohimarama areas of Auckland for rises of between 0.5 and 2.0 metres.
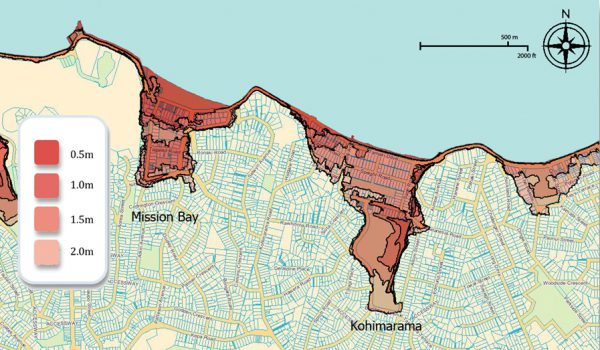
Figure 8: Effects of sea-level rise in parts of Auckland under inundation during a storm-tide with a 1% annual exceedance probability (100-year return period) [2].
It seems clear that hundreds of millions of people will face severe disruption to their lives as sea levels rise over the next hundred years and beyond. New Zealand will not be immune: almost every aspect of life and work will be affected. Careful planning will be necessary at local and central government levels to ensure that problems are contained as far as possible.
At national and international levels, it is critically important that governments recognize the scale and urgency of the problem, and act upon it by reducing very significantly global emissions of greenhouse gases. The cost of such measures will be substantial, but will be far less ultimately than the cost of impacts from a 'business as usual' pathway.
At local government levels, planning should already be happening to safeguard infrastructure at risk from sea level rise. Consideration needs to be given to legal challenges, costs, and liabilities. Sea defences may give temporary relief, but over a longer time-scale, accommodation and retreat appear to be more realistic and sustainable options.
A first step towards adaptation to future climate change is reducing vulnerability and exposure to present-day climate variability. However, over-investment of time and resources in short-term responses may limit future choices. For example, enhanced protection of assets can lock in dependence on further protection measures when these will ultimately not be able to deal with the rising sea level.
Adaptation should be incremental: that is, doing better or more of what we do now. It should also be transformational: we need to accept that something has to give, re-assess objectives and change course. We will need to balance protection, accommodation, and retreat. In some cases it will be possible to increase resilience to coastal hazards by softening the coastline, phasing out hard coastal walls, building a wide base in the water and creating a softly moulded coastline up to a height. Artificial islands using material from dredging can further attenuate the energy of storm surges. It has been proposed that floating breakwaters could be used both for storm surge mitigation and for accommodation [6], [7].
Consideration will need to be given to relocation of industries, transport routes and residential areas, and to diversification and balance of social, environmental, and economic objectives. This will need co-ordination across decision-makers. We will need to protect vulnerable parts of society and areas of cultural significance. For these things to happen, a stable consensus will be needed, and this will take time to build.
References
- Salinger, J., Climate Change - Living in a Warmer World, Engineers for Social Responsibility (ESR), Climate Change Paper No. 2, at www.esr.org.nz, 2013
- Reisinger, A., IPCC WGII for Dunedin, private communication, 2015
- Sheridan, K., New warning over rising seas, Weekend Herald (NZ), 29 August 2015
- Church, J.A., Rising sea level and our coastal society, Chapter 6 in Living in a Warmer World: How a Changing Climate Will Affect Our Lives, ed. Jim Salinger, CSIRO Publishing, 2013
- Hansen J., et al., Ice melt, sea level rise and superstorms: evidence from paleoclimate data, climate modeling, and modern observations that 1oC global warming is highly dangerous, Atmos. Chem. Phys. Discuss., 15, 20059–20179, 2015
- Gundermann, B., Adaptive Urbanism: Sea Level Rise, Resilience & Urban Development, Stephenson & Turner, Auckland, 2012
- Barnard, P.L., et al., Coastal vulnerability across the Pacific dominated by El Niño/Southern Oscillation, Nature Geoscience, 201
- IPCC, Summary for Policymakers. In: Climate Change 2013: The Physical Science Basis. Contribution of Working Group I to the Fifth Assessment Report of the Intergovernmental Panel on Climate Change [Stocker, T.F., D. Qin, G.-K. Plattner, M. Tignor, S.K. Allen, J. Boschung, A. Nauels, Y. Xia, V. Bex and P.M. Midgley (eds.)]. Cambridge University Press, Cambridge, United Kingdom and New York, NY, USA, 2013
- Brailsford, G., Stephens, B.B., Mikaloff Fletcher, S., Gomez, A.J., Riedel, K., McGregor, J., Steinkamp, K., Harvey, M., Trends in 40 year record of CO2 at Baring Head, New Zealand Climate Change Conference 2013, Palmerston North, N.Z., 2013
- Pollard, D., DeConto, R.M., Alley, R.B., Potential Antarctic Ice Sheet retreat driven by hydrofracturing and ice cliff failure, Earth and Planetary Science Letters 412: 112–121. doi: 10.1016/j.epsl.2014.12.035, 2015
- Rignot, E., Mouginot, J., Morlighem, M., Seroussi, H., Scheuch, B., Widespread, rapid grounding line retreat of Pine Island, Thwaites, Smith, and Kohler glaciers, West Antarctica, from 1992 to 2011, Geophysical Research Letters 41, doi:10.1002/2014GL060140, 2014
- Trusel, L.D., Frey, K.E., Das, S.B., Karnauskas, K.B., Munneke, P.K., van Meijgaard, E., van den Broeke, M.R., Divergent trajectories of Antarctic surface melt under two twenty-first-century climate scenarios, Nature Geoscience, Advance Online Publication. doi: 10.1038/NGEO2563, 2015
- NZ Ministry for the Environment, Coastal Hazards and Climate Change. A Guidance Manual for Local Government in New Zealand. 2nd edition. Revised by Ramsay, D. and Bell, R.G. (NIWA). Report ME892 prepared for Ministry for the Environment, Wellington, New Zealand. http://www.mfe.govt.nz/climate-change/climate-change-resources/guidance-local-government 2008
- Bell, R.G., Wadwha, S., National coastal susceptibility: Vulnerable areas and demographics, NIWA Client Report HAM2014-071 prepared for Centre for Research Evaluation and Social Assessment (CRESA), http://resilience.goodhomes.co.nz/publications 2014
- Parliamentary Commissioner for the Environment, Changing climate and rising seas: Understanding the science, http://www.pce.parliament.nz/publications/all-publications/changing-climate-and-rising-seas-understanding-the-science, 2014
- National Aeronautics and Space Administration (NASA), Global Climate Change, http://climate.nasa.gov/vital-signs/, 2016
- http://www.skepticalscience.com, 2016
- Harré, N., Climate change - a psychological challenge, Engineers for Social Responsibility
Climate Change series Paper 10, www.esr.org.nz, 2016 - Intergovernmental Panel on Climate Change (IPCC), https://www.ipcc.ch/publications_and_data, retrieved 2016
- Hansen, J., et al, Ice melt, sea level rise and superstorms: evidence from paleoclimate data, climate modeling, and modern observations that 2° C global warming could be dangerous, J. Atmos. Chem. Phys., 16, 3761–3812, 2016
- Golledge, N.R., Kowalewski, D.E, Naish, T.R., Levy, R.H., Fogwill, C.J., Gasson, E.G.W., The multi-millennial Antarctic commitment to future sea-level rise. Nature, 526, 421-425, 10.1038/nature15706, 2015
- DeConto, R.M., and Pollard, D., Contribution of Antarctica to past and future sea-level rise, Nature, 531, 591-597, doi: 10.1038/nature17145, 2016
- Stephens, S. (NIWA), The effect of sea-level rise on the frequency of extreme sea levels in New Zealand, Parliamentary Commissioner for the Environment, July 2015
Note
This paper was prepared by Lawrence Carter (ESR National Committee), from material supplied by Dr. Jim Salinger, Dr. John Church, Dr. Andy Reisinger, and others.
This paper has been peer reviewed by
Dr. Rob Bell, Programme Leader - Risk Impacts of Weather Related Hazards, National Institute of Water and Atmospheric Research (NIWA), and by Dr. James Renwick, Professor of Physical Geography, Victoria University of Wellington.
While the reviewers have provided comment on drafts of this article, they do not necessarily endorse it in its final form. The author is solely responsible for any errors and judgements that may exist in the published article.
v3.5 29th November, 2016