Climate Change and Primary Industry in New Zealand
The annual carbon dioxide equivalent of total global emissions is about 49 Gigatonnes (49 thousand million tonnes), using figures from 2010. Of this, ‘Agriculture’ produced about 11% (mostly as methane, but also N2O). Other ‘Land use,’ including carbon dioxide release from forest and peat burning, produced about 10%.
Climate Change
Global
The probability that humans are the main cause of current global warming is now greater than 95 percent [1]. There are risks associated with long-lasting changes to global climate for humans, animals, plants and entire ecosystems. Indeed, some are already no longer risks but locked in as future certainties1. Political efforts to limit global average temperature rise to less than 2°C above its value in pre-industrial times [i.e. more than 250 years ago] have been belated and reluctant. In December 2015, most countries of the world met in Paris at the UN Framework Convention on Climate Change 21st Conference of the Parties [COP21] and agreed to: “strengthen the global response to the threat of climate change, in the context of sustainable development and efforts to eradicate poverty, including by: (a) Holding the increase in the global average temperature to well below 2 °C above pre- industrial levels and pursuing efforts to limit the temperature increase to 1.5 °C above pre- industrial levels, recognizing that this would significantly reduce the risks and impacts of climate change.” Just how difficult this might prove to be is illustrated by the sudden change in slope of the blue line in Figure 1 [2]. It is further emphasised by some estimates that global average temperature increase above pre-industrial levels for the first three months of 2016 was already 1.4-1.5°C [3].
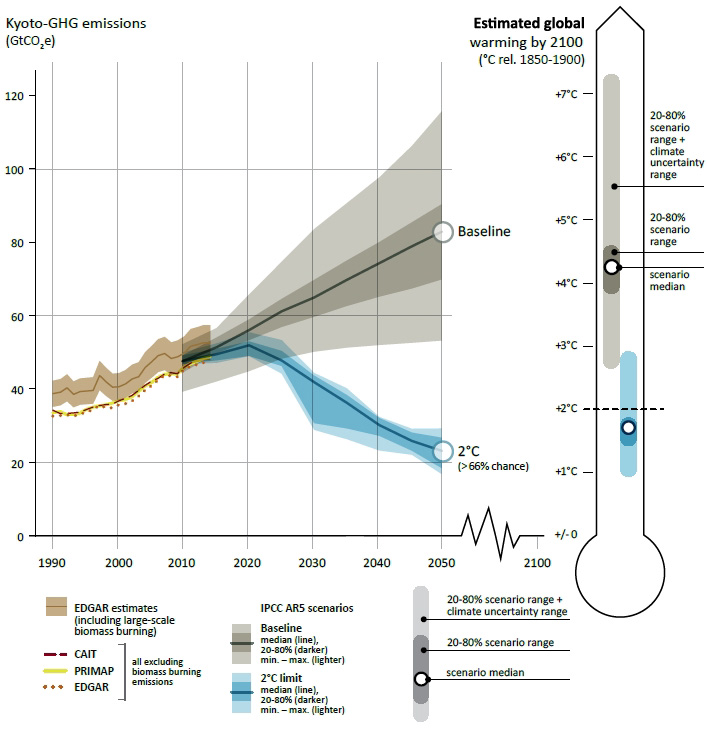
Figure 1. Historical greenhouse (GHG) emissions to 2014 and projections until 2050 according to various scenarios, including [blue line] to keep global warming by 2100 to less than 2°C above pre-industrial levels.
New Zealand [7]
Based on evidence in scientific publications on climate change from 2001 to 2010, major climate change impacts in New Zealand are expected to be on: land-based ecosystems; water resources, floods and/or droughts; marine ecosystems; glaciers, snow and ice; and food production. Four of these, excepting glaciers, snow and ice, are significant to primary industry. There are direct climate changes, such as temperature, rainfall intensity and volume, and wind speed and direction changes; and consequential changes such as soil moisture, groundwater and sea levels and occurrence of frost and drought.
The major direct climate changes expected are to temperature and rainfall. Average temperatures are likely to increase, more in the North Island than in the South Island, and most of all in North-East New Zealand. Summer rainfall is likely to increase in the North and East of the North Island; Winter rainfall is likely to increase in the South Island, especially on the West Coast and in Otago and Southland. There are also likely to be increases in intense rainfalls and changes to wind directions and speeds.
The major indirect climate changes expected are increased sea levels, increased flooding, longer and more severe droughts, increased frosts in some places but longer frost- free periods in others and increased wildfires.
Although the “key risks” for New Zealand identified in the IPCC 2014 report [7] are increased damage from flooding, wildfires and sea level rise, the key risks for primary industry are likely to be the disruption caused by changes in temperature and rainfall and their indirect effects, including drought and frost patterns.
Primary Industry
‘Primary’ industry is usually taken to include those industries based on obtaining natural resources and turning them in to useful products. In New Zealand that includes: agriculture; horticulture; viticulture; forestry and logging; fishing and aquaculture; and mining. There is a Ministry for Primary Industries [8] concerned with exporting, productivity, food safety, sustainable resource use, and biosecurity.
The importance of primary industry to the New Zealand economy lies in its significant contribution to export earnings. In 2015 [9], primary industry accounted for 8% of total Gross Domestic Product [10] but almost exactly 50% of total goods exported to all countries [11]. Of those primary industry exports, the dairy industry provided about 25% in 2015 [12].
Turning natural resources into useful products often has a downside in the form of unwanted effects on the environment. Such effects include landscape changes by mining, unintended catch of endangered species during fishing and, in the present context of climate change, emissions of greenhouse gases by livestock or as a result of oil and coal extraction and use. On the other hand, the forest industry can have a positive effect on the environment by incorporating atmospheric carbon dioxide in wood products which delay its return to the atmosphere by decades or centuries.
Emissions
Global
Carbon dioxide is not the only greenhouse gas. Both methane (CH4) and nitrous oxide (N2O) are important emissions from agriculture. There are five long-lived greenhouse gases that contribute 96% to greenhouse effects [‘radiative climate forcing’]: the previous three plus chlorofluorocarbon gases, previously common as refrigerants, and spraycan propellants. CO2 and N2O continue to increase at a regular rate while increases in radiative forcing from CH4 vary substantially annually [13]. Radiative forcing from CH4 increased from 2007 to 2015 after remaining nearly constant from 1999 to 2006. Methane has a ‘global warming potential’ [14] about 25 times that of carbon dioxide [15], [21] and nitrous oxide about 300 times [15], [21]. So emissions from agriculture and other primary industry are counted in ‘equivalent’ carbon dioxide. Of total human-induced [‘anthropogenic’] global emissions in
2010 of about 47-57 Gigatonnes1, [16] of carbon dioxide equivalent per year [GtCO2e/yr], Agriculture, Forestry and Other Land Use [AFOLU] was thought to contribute 11 to 13 GtCO2e/yr, or 24%. Figure 2 shows total human activity emissions 1970- 2010 according to the gases involved. Forestry and other land use [FOLU] CO2 excludes agriculture, which contributes much of the methane and nitrous oxide.
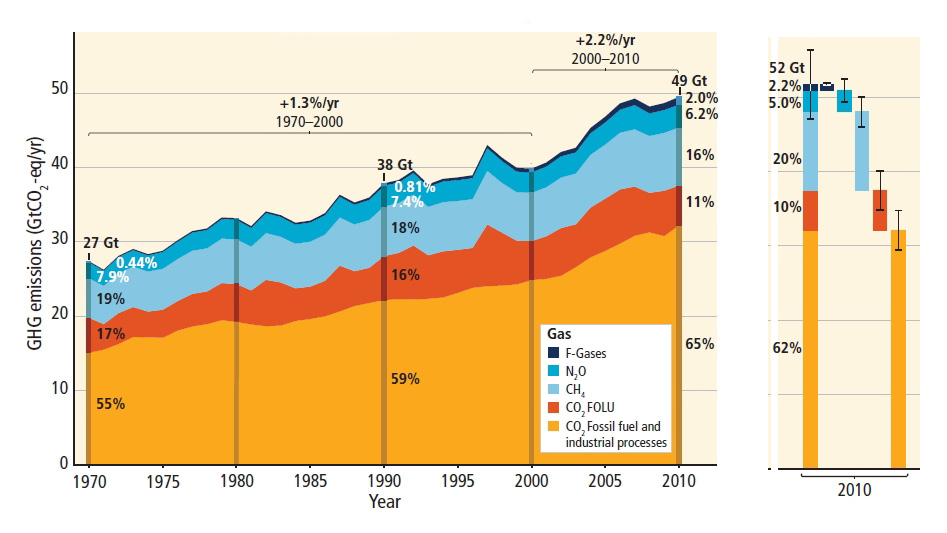
Figure 2. Total annual anthropogenic GHG emissions by gases 1970-2010.
The rate of increase of global emissions of greenhouse gases, about 2.2% per year on average 2000-2010, slowed to about 1% in 2012 and 2013, then 0.5% in 2014. The world economy grew by about 3% in 2014 which was also the warmest year globally since records began in 1880. This ‘decoupling’ of emissions growth from economy growth has only occurred once previously since 1998 [17].
New Zealand
In the context of climate change, New Zealand differs in several important ways from many other countries. The proportion of total emissions due to ‘Agriculture’, and the proportion of ‘Agriculture’ emissions due to methane and nitrous oxide [18], are higher than in most countries. According to the most recent official report on New Zealand emissions under the UN Framework Convention on Climate Change [19], based on 2013 data, total nett emissions [including a negative contribution of - 26.76 Million tonnes of carbon dioxide equivalent per year (MtCO2e/yr) [20] from ‘Land Use, Land use Change and Forestry’] were 54.20 MtCO2e/yr. ‘Agriculture’ accounted for 26.23 MtCO2e/yr or 48.4%; this is approximately double the global average for ‘Agriculture, Forestry and Other Land Use’ [see above], although the accounting year and category contents differ slightly. Methane at 23.85 MtCO2e/yr made up 44.0% of total nett emissions, slightly more than carbon dioxide [42.7%]; this is 2.75 times the global average shown in Figure 2, with again the caution that the time period differs. Nitrous oxide at 6.07 MtCO2e/yr made up 11.2% of total nett emissions; this is 1.8 times the global average shown in Figure 2, with again the caution that the time period differs. The significance of ‘biological’ emissions for New Zealand, and the acknowledged difficulty of knowing what to do about them, are prime reasons why a 2016 report [21] of the Parliamentary Commissioner for the Environment is focused on these topics.
There are comprehensive and detailed data on agriculture, forestry and other land use emissions for many countries, including New Zealand, provided by the UN Food and Agriculture Organisation [22]. These are currently based on data up to 2014. Care is needed in using the data for New Zealand as categories and time periods might differ from those in the New Zealand report to the UN Framework Convention on Climate Change and in the IPCC 2014 reports [1], [23], [33].
Adaptation and Mitigation
Adaptation
In the context of climate change, ‘adaptation’ is the process of adjustment to actual or expected climate and climatic effects [23]. Although there is a New Zealand Central Government web page on “Adapting to climate change” [24], it is mostly concerned with guidance from and to central and local government, regional climate change and sea level rise.
The most relevant information on adaptation and primary industry is in the ‘Australasia’ chapter [25] of the IPCC 2014 report of Working Group II on Impacts, Adaptation, and Vulnerability [25]. For freshwater resources, the authors note that “there is little evidence of water resources adaptation specifically to climate change.” Plantation forests could have increased productivity from increased carbon dioxide levels but there is still uncertainty about tree responses and about climate change in regions. Irrigation for agriculture is an existing adaptation to climate and climate variability and the area consented for irrigation has increased from about 0.59 Mha in 1999 to over 1 Mha in 2010 [26]. Total area actually equipped for irrigation was 0.72 Mha in 20129. Sea level rise, ocean acidification and increasing air and sea temperatures are regarded as ‘emerging issues’ in fisheries management, rather than being current adaptation [27]. A 2016 review28 of impacts on “Marine Fisheries, Aquaculture, Coastal Tourism and Human Health” concentrates on the Northern Hemisphere, but with a few references to Australia and Pacific Islands. It includes a section on “Coastal Adaptation”, but few references to mitigation.
The IPCC Working Group II report [25] distinguishes between “incremental” [building on existing] change and “transformative” [a break with the old] change. A recent journal article [29] dealing with “climate change-resilient farming systems” points out that, while temperature and rainfall [water availability] are key factors for crop growth, a host of other factors are also subject to climate change: occurrence in time and space of insect pests, pathogens and weeds included. Incremental adaptation might assist farming in the short term but there might need to be transformative adaptation to provide longer-lasting benefits. This article observes that resiliency to historic climate adverse events suggests that future adaptation should learn from traditional farming systems and the benefits of: “polycultures, agroforestry systems, and crop-livestock mixed systems accompanied by organic soil management, water conservation and harvesting, and general enhancement of agrobiodiversity.”
Mitigation
‘Mitigation’ is active intervention to reduce emissions or enhance absorption of greenhouse gases [23]. One important mitigation related to mining is to reduce coal use by substituting fuels which provide thermal energy at economic cost with less carbon dioxide emission. Total coal production in New Zealand has decreased from a peak of about 5.5 Mt/yr [30] in 2006 to about 4.0 Mt/yr in 2014 [31]. Nearly half, the low ash and sulphur content ‘bituminous’ coal, is exported and used for making steel [thus emitting carbon dioxide in other countries]. Just over half, the less valuable ‘sub-bituminous’ and lignite coal, is still used in New Zealand for electricity generation, manufacturing and heating buildings. Emissions from coal use in 2013 are estimated to have been about 4.5 MtCO2e/yr [32].
The most relevant information on mitigation of emissions from pastoral agriculture in New Zealand is the 2016 report [21] of the Parliamentary Commissioner for the Environment previously cited. Further information on mitigation and primary industry is in the ‘Agriculture, Forestry and Other Land use” chapter [11] of the IPCC 2014 report of Working Group III on “Mitigation of Climate Change” [33]. Although this does not have a ‘regional’ section on ‘New Zealand’ or ‘Australasia’, much of the general information on mitigation by emissions reduction and by enhancement of removal of greenhouse gases is applicable here. Deforestation and forest fires are not as significant in New Zealand as in many other countries; further afforestation by planting of indigenous or exotic trees could be a significant and achievable mitigation21. Bioenergy from biomass might play a role in mitigating emissions from primary industries [and for transport energy], but will need to be efficient and involve sustainable land use [33].
Another recent journal article [34] on “Reducing emissions from agriculture to meet the 2°C target” identifies “a preliminary global target for reducing emissions from agriculture of ~1 GtCO2e/yr by 2030 to limit warming in 2100 to 2°C above pre-industrial levels". But it concludes that plausible scenarios of agricultural development and mitigation only provide 21-40% of the mitigation needed. This article suggests that “more transformative technical and policy options will be needed, such as methane inhibitors and finance for new practices... soil carbon and agriculture-related mitigation options.” Because New Zealand has such a high proportion of its emissions as methane and nitrous oxide, mitigation options for livestock farming, especially dairy cattle, are urgently sought. A specialist research institute has been set up [35], engaged in international research. It is internationally recognised that the emissions from livestock farming have to be urgently addressed and that this is even more difficult because there is growing global demand for livestock products [36].
Discussion
There is much data and information available online and in published literature on climate change, including some specific to New Zealand; the same is true of primary industry. Putting them together as ‘climate change and primary industry in New Zealand’, as here, there is still a lot of data and information but it is not always readily compatible. A further difficulty is that data and statistics do not always align neatly in the categories and time periods used by different agencies. The nature of published climate change data ensures that they are often not available right up to the present time and that the values are out of date straight after they are published. Those difficulties are apparent in the summary of data and information presented here.
Not much reference is made here to social and political aspects of the topic, a deliberate choice to limit the length of presented material. Mention should be made, however, that New Zealand has official Central Government emissions reductions targets and an Emissions Trading Scheme which is intended to “support global efforts to reduce greenhouse gas emissions while maintaining economic productivity” [37]. For more on New Zealand’s international commitments, including targets and the Emissions Trading Scheme, see other sheets in this ESR series on climate change [6].
References
All internet addresses cited responded correctly when checked on 27 October 2016.
- IPCC (2014) Climate Change 2014: Synthesis Report. Contribution of Working Groups I, II and
- Figure ES1 in: UNEP (2015). The Emissions Gap Report 2015. United Nations Environment Programme (UNEP), Nairobi.
- E.G. an average of NOAA and NASA data adjusted from their temperature baselines by Climate central, http://www.climatecentral.org/news/world-flirts-with-1.5C-threshold-20260.
- Usually presented as ‘parts per million (ppm)’, often without stating that it is parts ‘of carbon’; 280 ppm C equates to 1027 ppm CO2 (Carbon molecular mass 12, oxygen 16, so carbon dioxide 44 and 44/12=3.667).
- http://www.noaa.gov/record-annual-increase-carbon-dioxide-observed-mauna-loa-2015. 6
- See http://www.esr.org.nz Climate Change papers.
- Based largely on the Topic 2 report in IPCC, 2014, Note 1 above.
- https://www.mpi.govt.nz/
- Statistics are from http://www.stats.govt.nz/infoshare/
- Annual GDP represents the monetary value added of all goods and services produced within New Zealand in a year. NZ total GDP in 2015 was about NZ$219.8 Billion; primary industry GDP was about NZ$17.6 Billion.
- About NZ$47 Billion of primary industry goods of a total about NZ$94 Billion of goods exported.
- About NZ$12 Billion in 2015.
- Butler JH; Montzka SA; (2016) The NOAA Annual Greenhouse Gas Index (AGGI), NOAA Earth System Research Laboratory. http://esrl.noaa.gov/gmd/aggi/aggi.html.
- Greenhouse gases also persist in the atmosphere for different lengths of time, so these are warming potentials averaged over 100 years.
- But see more detail in Information Sheet 4 of the ESR Climate Change papers, Note 6 above.
- A Gigatonne is a thousand million tonnes, or 109 tonnes. Values from IPCC 2014, 1 above, including revised warming potentials – see 13 above.
- Olivier JGJ; Janssens-Maenhout G; Muntean M; Peters JAHW (2015) Trends in global CO2 emissions; 2015 Report, The Hague: PBL Netherlands Environmental Assessment Agency; Ispra: European Commission, Joint Research Centre.
- Most biogenic methane comes from burping by cattle, sheep and other ruminant animals. Most biogenic nitrous oxide comes from the action of soil microbes on the nitrogen-containing urea in farm animal urine.
- Ministry for the Environment. 2015. New Zealand’s Second Biennial Report under the United Nations Framework Convention on Climate Change. Wellington: Ministry for the Environment.
- A Megatonne is a million tonnes, or 106 tonnes.
- Parliamentary Commissioner for the Environment (2016) Climate change and agriculture: Understanding the biological greenhouse gases. New Zealand Government, Wellington.
- UN FAO FAOSTAT http://faostat3.fao.org/home/E , seen 5 August 2016.
- Annex II: Glossary [Mach, K.J., S. Planton and C. von Stechow (eds.)]. In: 1, above, pp. 117-130.
- http://www.mfe.govt.nz/climate-change/adapting-climate-change/about-adapting-climate-change.
- Reisinger, A., R.L. Kitching, F. Chiew, L. Hughes, P.C.D. Newton, S.S. Schuster, A. Tait, and P. Whetton (2014): Australasia. In: Climate Change 2014: Impacts, Adaptation, and Vulnerability. Part B: Regional Aspects. Contribution of Working Group II to the Fifth Assessment Report of the Intergovernmental Panel on Climate Change [Barros, V.R., C.B. Field, D.J. Dokken, M.D. Mastrandrea, K.J. Mach, T.E. Bilir, M. Chatterjee, K.L. Ebi, Y.O. Estrada, R.C. Genova, B. Girma, E.S. Kissel, A.N. Levy, S. MacCracken, P.R. Mastrandrea, and L.L. White (eds.)]. Cambridge University Press, Cambridge, United Kingdom and New York, NY, USA, pp. 1371-1438.
- Rajanayaka C; Donaggio J; McEwan H (2010). Update of Water Allocation Data and Estimate of Actual Water Use of Consented Takes - 2009-10. Aqualinc Research Ltd Report No 10002/3 for Ministry for Environment.
- Ministry for Primary Industries (2016). Aquatic Environment and Biodiversity Annual Review 2015. Compiled by the Fisheries Management Science Team, Ministry for Primary Industries, Wellington, New Zealand. 682 p.
- Weatherdon LV; Magnan AK; Rogers AD; Sumaila UR; Cheung WWL (2016) Observed and Projected Impacts of Climate Change on Marine Fisheries, Aquaculture, Coastal Tourism, and Human Health: An Update. Frontiers in Marine Science Vol. 3, Article 48, April.
- Altieri MA; Nicholls CI; Henao A; Lana MA (2015) Agroecology and the design of climate change-resilient farming systems. Agron.Sustain.Dev. 35:869–890, DOI 10.1007/s13593-015-0285-2.
- Megatonnes per year; millions of tonnes per year.
- See e.g. http://www.mbie.govt.nz/info-services/sectors-industries/energy/energy-data- modelling/statistics/coal.
- MBIE (2014) Energy Greenhouse Gas Emissions. Ministry of Business, Innovation and Employment, Wellington.
- Smith P., M. Bustamante, H. Ahammad, H. Clark, H. Dong, E. A. Elsiddig, H. Haberl, R. Harper, J. House, M. Jafari, O. Masera, C. Mbow, N. H. Ravindranath, C. W. Rice, C. Robledo Abad, A. Romanovskaya, F. Sperling, and F. Tubiello, 2014: Agriculture, Forestry and Other Land Use (2014). In: Climate Change 2014: Mitigation of Climate Change. Contribution of Working Group III to the Fifth Assessment Report of the Intergovernmental Panel on Climate Change [Edenhofer, O., R. Pichs-Madruga, Y. Sokona, E. Farahani, S. Kadner, K. Seyboth, A. Adler, I. Baum, S. Brunner, P. Eickemeier, B. Kriemann, J. Savolainen, S. Schlömer, C. von Stechow, T. Zwickel and J.C. Minx (eds.)]. Cambridge University Press, Cambridge, United Kingdom and New York, NY, USA.
- Wollenberg E; M. Richards P. Smith, P. Havlík, M. Obersteiner, F.N. Tubiello, M. Herold,P. Gerber, S. Carter, A. Reisinger, D. van Vuuren, A. Dickie, H. Neufeldt, B.O. Sander, R. Wassmann, R. Sommer, J.E. Amonette, A. Falcucci, M. Herrero, C. Opio, R. Roman-Cuesta, E. Stehfest, H. Westhoek, I. Ortiz-Monasterio, T. Sapkota, M.C. Rufino, P.K. Thornton, L. Verchot, P.C. West, J.- F.Soussana, T. Baedeker, M. Sadler, S. Vermeulen, B.M. Campbell (2016) Reducing emissions from agriculture to meet the 2°C target. Global Change Biology, 22(12):3859-3864.
- New Zealand Agricultural Greenhouse Gas Research Centre, http://www.nzagrc.org.nz/.
- Gerber, PJ; Steinfeld H; Henderson B; Mottet A; Opio C; Dijkman J; Falcucci A; Tempio G
(2013) Tackling climate change through livestock – A global assessment of emissions and mitigation
opportunities. Food and Agriculture Organization of the United Nations (FAO), Rome. - See http://www.mfe.govt.nz/climate-change/reducing-greenhouse-gas-emissions/emissions-reductions-targets and http://www.mfe.govt.nz/climate-change/reducing-greenhouse-gas-emissions/new-zealand-emissions-trading-scheme.
This paper was peer reviewed by
Dr Paul Newton, Principal Scientist, Land and Environment, Agresearch Grasslands.
While the reviewer has provided comment on drafts of this article, he does not necessarily endorse it in its final form. The author is solely responsible for any errors and judgements that may exist in the published article.
v2.4 24th November, 2016