New Zealand’s Paris Target
Wonky carbon accounting hides NZ’s feeble Paris commitment.
New Zealand’s commitment under the Paris Agreement, as stated in our Intended Nationally Determined Contribution (INDC) [1], which became our Nationally Determined Contribution (NDC) after we ratified the agreement in October 2016 [2], reads as follows:
Emissions will be reduced to 30% below 2005 levels by 2030. The 2005 reference has been chosen for ease of comparability with other countries. This responsibility target corresponds to a reduction of 11% from 1990 levels.
At face value, the above statement appears clear and understandable, but it is actually quite unclear because there are two accepted measures for emissions: gross or total emissions; and net emissions which are total emissions less deductions allowed for land use, land-use change and forestry (LULUCF), which in our case relate mainly to carbon dioxide taken out of the atmosphere by trees. Neither the New Zealand INDC, nor the supplementary NDC documentation, state clearly whether we are using gross emissions, net emissions, a mix of these, or some other measure to define our Paris target.
In defining our target under the Kyoto Protocol first commitment period we used the inconsistent technique of comparing gross emissions in the base year (1990) with net emissions in the target year (2012), but this was in the early days of the development of carbon accounting.
One would reasonably expect that we had now moved to a consistent method of defining targets. However, according to an expert in this field, the New Zealand government is still using the gross-net comparison for Paris. This was confirmed after seeking clarification from Hon Paula Bennett, Minister for Climate Change Issues [3].
It all became really clear with the recent release of the final report from the current Parliamentary Commissioner for the Environment, Dr Jan Wright [4]. For the first time in any official document I have seen, she confirms we are using the gross-net approach, pointing out that, “The New Zealand targets confusingly compare future net emissions with gross emissions in different base years”.
This inconsistent gross-net comparison is an inappropriate and highly misleading form of carbon accounting. If you calculate the target on a consistent net-net basis you get completely different results. This is not surprising because the 1990 net emissions figure is 46% below the 1990 gross, and the 2005 net figure is 35% below the 2005 gross.
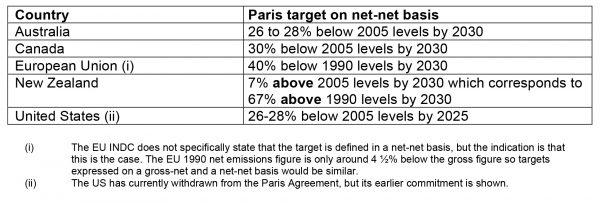
While the government’s INDC gives our Paris target as 30% below 2005 levels by 2030, which corresponds to 11% below 1990 levels, calculations based on the most recently available emissions data [5] give it on a consistent net-net basis as 7% above 2005 levels by 2030, which corresponds to 67% above 1990 levels - the same figure as is given in Dr Jan Wright’s report. The 2030 target is also above the most recent figures for current emissions levels.
Dr Wright’s report also provides a figure showing how the timeline of our net emissions to date relates to the various targets our government has set. These targets are listed below, first as presented by the government on a gross-net basis, followed (in brackets) with the same target expressed in consistent net-net terms:
- Kyoto Protocol, first commitment period: Reduce net emissions to the 1990 gross level by 2012. (Increase net emissions to 87% above the 1990 net level by 2012.)
- Copenhagen Accord: Reduce net emissions to 5% below the 1990 gross level by 2020.(Increase net emissions to 78% above the 1990 net level by 2020.)
- Paris Agreement: Reduce net emissions to 30% below the 2005 gross level by 2030.(Increase net emissions to 7% above 2005 net level by 2030.)
- 50 by 50 target: Reduce net emissions to 50% below the 1990 gross level by 2050.(Reduce net emissions to 6% below the 1990 net level by 2050.)Using these revised figures, we can now compare New Zealand’s target with those of some other developed countries.

Attribution: Wright, J, Parliamentary Commissioner for the Environment, Stepping Stones to Paris and Beyond, July 2017
Using these revised figures, we can now compare New Zealand’s target with those of some other developed countries.
To control climate change, the world needs to become carbon-neutral by the end of the century, and preferably a lot earlier. This requires a rapid reduction in global emissions.
The Paris Agreement is a significant step forward, with the key objective being to hold global warming to well below 2°C above pre-industrial levels and to pursue efforts to limit this increase to 1.5°C. However, scientists tell us that even if all nations were to achieve their NDC’s, these combined commitments are still too weak to hold global warming to under 2°C, let alone to under 1.5°C.
New Zealand’s Paris commitment is much weaker than the government’s emissions reduction figures suggest and compares extremely poorly with the commitments of many other countries. According to this commitment, New Zealand is actually undertaking to increase emissions above current levels by 2030, not to reduce them.
The government’s failure to define its Paris target using consistent methods of measuring emissions for both the base and future years, coupled with its failure to clearly document and explain how the target figures are actually derived, is obscuring the appalling weakness of New Zealand’s Paris target, both from the international community and from the New Zealand public.
Further notes
New Zealand – The figures given here for the net-net emissions increases are based on figures from the NZ 2015 Greenhouse Gas Inventory and are rounded down to the nearest percent. Full details of the way in which net emissions will be defined for the purpose of accounting against targets in future years have yet to be finalised by the government. At present, each time a new Greenhouse Gas Inventory is released, the historic figures for both net and gross emissions are revised. This means that details of the 2030 target, and how this compares with 1990 and 2005 levels, will vary somewhat depending on what year’s Greenhouse Gas Inventory is used to obtain data.
Other countries listed above – Australia, Canada and the US state in their INDCs that their targets are defined on a net-net basis. For some of these countries there are qualifications to the net accounting methods and how these will be used in the future, which are outlined in their INDC’s [6], [7], [8], [9].
Calculations
According to the NZ INDC, and other separate clarifying information, the 2030 net target is 30% below the 2005 gross level. Using data from the NZ 2015 Greenhouse Gas Inventory, based on the 2005 gross figure of 82,493.69 kt pa, the 2030 net target is 82,493.69 * (100 – 30)% = 57,745.58 kt pa. This target is 67.6% above the 1990 net figure of 34,451.43 kt pa, 7.6% above the 2005 net figure of 53,676.77 kt pa, and 2.4% above the 2015 net figure of 56,372.51 kt pa.
In relation to the other targets given: The Kyoto First Commitment Period target was to reduce net emissions to the 1990 gross level of 64,573.82 kt pa by 2012, which is equivalent to an increase from the 1990 net emissions of 34,451.43 kt pa by 87%. The Copenhagen-related target to reduce net emissions to 5% below the 1990 gross level by 2020 gives a target of 61,345.13 kt pa which is 78% above the 1990 net figure. The 50% below 1990 gross levels by 2050 gives a target of 32,286.91 kt pa which is 6% below the 1990 net figure.
References
- New Zealand INDC https://www4.unfccc.int/sites/submissions/INDC/Published%20Documents/New%20Zealand/1/New%20Zealand%20INDC%202015.pdf
- New Zealand NDC http://www4.unfccc.int/ndcregistry/PublishedDocuments/New%20Zealand%20First/New%20Zealand%20first%20NDC.pdf
- Hon Paula Bennett, personal communication with Peter Whitmore, August 2017
- Wright, Dr Jan, Parliamentary Commissioner for the Environment, Stepping stones to Paris andbeyond, July 2017.
- NZ Ministry for the Environment, New Zealand’s Greenhous Gas Inventory, 1990-2015.
- Australia INDC, at http://www4.unfccc.int/Submissions/INDC/Published%20Documents/Australia/1/Australias%20Intended%20Nationally%20Determined%20Contribution%20to%20a%20new%20Climate%20Change%20A greement%20-%20August%202015.pdf
- Canada INDC, at http://www4.unfccc.int/Submissions/INDC/Published%20Documents/Canada/1/INDC%20-%20Canada%20-%20English.pdf
- EU INDC, at http://www4.unfccc.int/submissions/INDC/Published%20Documents/Latvia/1/LV-03-06-EU%20INDC.pdf
- US INDC, at http://www4.unfccc.int/Submissions/INDC/Published%20Documents/United%20States%20of%20America/1/U.S.%20Cover%20Note%20INDC%20and%20Accompanying%20Information.pdf
This paper was peer reviewed by
Professor James Renwick, School of Geography, Environment and
Earth Sciences, Victoria University of Wellington, and Lead Author, Chapter 14, IPCC AR5 WG1 Report.
While the reviewer has provided comment on drafts of this article, he does not necessarily endorse it in its final form. The author is solely responsible for any errors and judgements that may exist in the published article.
v.1.2, 14th September 2017